I believe that a call graph showing the total function time (that is, the time spent inside the function and all its descendants) is one of the most useful visualizations of profile data, as it allows to quickly grasp what is the critical code path in your program that is taking most of the execution time.
Total function time is typically calculated by propagating the time along the call graph, from callees to callers. The problem with measuring total function time are recursive functions, as noted on gprof article:
Time propagation within strongly connected components is a problem. For example, a self-recursive routine (a trivial cycle in the call graph) is accountable for all the time it uses in all its recursive instantiations. In our scheme, this time should be shared among its call graph parents. The arcs from a routine to itself are of interest, but do not participate in time propagation. Thus the simple equation for time propagation does not work within strongly connected components. Time is not propagated from one member of a cycle to another, since, by definition, this involves propagating time from a routine to itself. In addition, children of one member of a cycle must be considered children of all members of the cycle. Similarly, parents of one member of the cycle must inherit all members of the cycle as descendants. It is for these reasons that we collapse connected components. Our solution collects all members of a cycle together, summing the time and call counts for all members. All calls into the cycle are made to share the total time of the cycle, and all descendants of the cycle propagate time into the cycle as a whole. Calls among the members of the cycle do not propagate any time, though they are listed in the call graph profile.
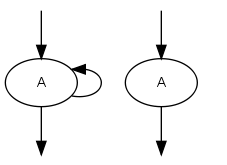
This means that, for example, the recursive call of of singly recursive functions is ignored:
 <
<
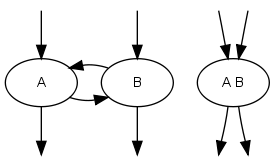
And recursion cycles with two or more functions are collapsed in a single node:

In summary, the call graph is converted in a Directed Acyclic Graph (DAG).
However this approach has several drawbacks. By treating alls functions in a recursion cycle as a single entity, you loose the ability to differentiate among them; you cannot prune individually the functions which have little contribution to the overall time, so the call graph gets bigger and more complex. Furthermore, nothing prevents a call graph to be full of recursion cycles. Actually, if you throw in the mix a statistical profiler like oprofile which produces spurious calls when the instruction pointer is sampled before/after the stack frame is setup/destroyed, and a environment like the linux kernel where there are IRQs artificially introducing function calls to the IRQ handler, you'll probably also end up with a 400KB dot file of spaghetti inside, which graphviz's dot chews for all eternity.
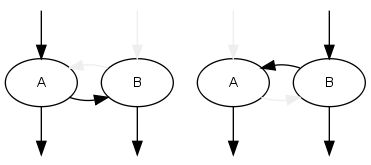
I tried to find a better solution for several months. Most attempts ended up with my head in an infinite loop. The solution eventually came to me once I realized that time is a linear quantity, that is, if you propagate the time along the graph assuming zero time for all but one function, repeat for every function, and take the overall sum, then you will reach the same results as doing the computation in a single pass. Given this, and the fact that by using the gprof approach we already know the time being propagated into and out of the cycle, we can then try to estimate the time propagation inside the cycle by decompose the cycle into a DAG having as root each function that is called externally. For example, taking the two function recursion example above, you can decompose the call graph in two cases:

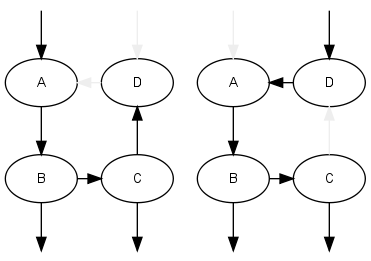
Then it is just a matter of propagating the partial time for each case, and take the total sum. The same thing can be done with any number of nodes:

The end result is an heuristic that enables gprof2dot to visually differentiate and prune recursive functions as any other function, producing consistent and meaningful results.
No comments:
Post a Comment