04 September 2008

Learning and testing Gallium3D with Python

Gallium3D interfaces don't match any particular graphics API 1 to 1. Likewise, conformance tests end up not doing a good coverage of Gallium3D's interface either: sometimes a single Gallium3D feature is tested in many different tests; sometimes a feature ends up not being exercised by any test, so bugs are only detected in applications, where they are much harder to narrow down. And so appeared the need to write some tests at the Gallium3D interface level.

Since the ability to write tests quickly was important, and the running speed not so important, I've decided to write a Python bindings, so that tests could be scripted in Python. These bindings wrap around the pipe driver, so that they look like a pipe driver from the Python script point of view, and look like a state tracker from the pipe driver point of view.

About the tests there is not much to write about yet. I wrote tests for texture formats that allowed to squash the bugs I was searching for, and I imagine that more tests will be added as needs justify it.

However, having a Gallium3D bindings in Python opens several doors. One particularly is that it becomes a nice sandbox to learn Gallium3D. For example. here is the code to draw a single triangle:

def test(dev):
    ctx = dev.context_create()

    width = 255
    height = 255

    # disabled blending/masking
    blend = Blend()
    blend.rgb_src_factor = PIPE_BLENDFACTOR_ONE
    blend.alpha_src_factor = PIPE_BLENDFACTOR_ONE
    blend.rgb_dst_factor = PIPE_BLENDFACTOR_ZERO
    blend.alpha_dst_factor = PIPE_BLENDFACTOR_ZERO
    blend.colormask = PIPE_MASK_RGBA
    ctx.set_blend(blend)

    # no-op depth/stencil/alpha
    depth_stencil_alpha = DepthStencilAlpha()
    ctx.set_depth_stencil_alpha(depth_stencil_alpha)

    # rasterizer
    rasterizer = Rasterizer()
    rasterizer.front_winding = PIPE_WINDING_CW
    rasterizer.cull_mode = PIPE_WINDING_NONE
    rasterizer.bypass_clipping = 1
    rasterizer.scissor = 1
    #rasterizer.bypass_vs = 1
    ctx.set_rasterizer(rasterizer)

    # viewport (identity, we setup vertices in wincoords)
    viewport = Viewport()
    scale = FloatArray(4)
    scale[0] = 1.0
    scale[1] = 1.0
    scale[2] = 1.0
    scale[3] = 1.0
    viewport.scale = scale
    translate = FloatArray(4)
    translate[0] = 0.0
    translate[1] = 0.0
    translate[2] = 0.0
    translate[3] = 0.0
    viewport.translate = translate
    ctx.set_viewport(viewport)

    # samplers
    sampler = Sampler()
    sampler.wrap_s = PIPE_TEX_WRAP_CLAMP_TO_EDGE
    sampler.wrap_t = PIPE_TEX_WRAP_CLAMP_TO_EDGE
    sampler.wrap_r = PIPE_TEX_WRAP_CLAMP_TO_EDGE
    sampler.min_mip_filter = PIPE_TEX_MIPFILTER_NONE
    sampler.min_img_filter = PIPE_TEX_MIPFILTER_NEAREST
    sampler.mag_img_filter = PIPE_TEX_MIPFILTER_NEAREST
    sampler.normalized_coords = 1
    ctx.set_sampler(0, sampler)

    # scissor
    scissor = Scissor()
    scissor.minx = 0
    scissor.miny = 0
    scissor.maxx = width
    scissor.maxy = height
    ctx.set_scissor(scissor)

    clip = Clip()
    clip.nr = 0
    ctx.set_clip(clip)

    # framebuffer
    cbuf = dev.texture_create(
        PIPE_FORMAT_X8R8G8B8_UNORM, 
        width, height,
        tex_usage=PIPE_TEXTURE_USAGE_DISPLAY_TARGET,
    )
    _cbuf = cbuf.get_surface(usage = PIPE_BUFFER_USAGE_GPU_READ|PIPE_BUFFER_USAGE_GPU_WRITE)
    fb = Framebuffer()
    fb.width = width
    fb.height = height
    fb.num_cbufs = 1
    fb.set_cbuf(0, _cbuf)
    ctx.set_framebuffer(fb)
    _cbuf.clear_value = 0x00000000
    ctx.surface_clear(_cbuf, _cbuf.clear_value)
    del _cbuf
    
    # vertex shader
    vs = Shader('
        VERT1.1
        DCL IN[0], POSITION, CONSTANT
        DCL IN[1], COLOR, CONSTANT
        DCL OUT[0], POSITION, CONSTANT
        DCL OUT[1], COLOR, CONSTANT
        0:MOV OUT[0], IN[0]
        1:MOV OUT[1], IN[1]
        2:END
    ')
    ctx.set_vertex_shader(vs)

    # fragment shader
    fs = Shader('
        FRAG1.1
        DCL IN[0], COLOR, LINEAR
        DCL OUT[0], COLOR, CONSTANT
        0:MOV OUT[0], IN[0]
        1:END
    ')
    ctx.set_fragment_shader(fs)

    nverts = 3
    nattrs = 2
    verts = FloatArray(nverts * nattrs * 4)

    verts[ 0] = 128.0 # x1
    verts[ 1] =  32.0 # y1
    verts[ 2] =   0.0 # z1
    verts[ 3] =   1.0 # w1
    verts[ 4] =   1.0 # r1
    verts[ 5] =   0.0 # g1
    verts[ 6] =   0.0 # b1
    verts[ 7] =   1.0 # a1
    verts[ 8] =  32.0 # x2
    verts[ 9] = 224.0 # y2
    verts[10] =   0.0 # z2
    verts[11] =   1.0 # w2
    verts[12] =   0.0 # r2
    verts[13] =   1.0 # g2
    verts[14] =   0.0 # b2
    verts[15] =   1.0 # a2
    verts[16] = 224.0 # x3
    verts[17] = 224.0 # y3
    verts[18] =   0.0 # z3
    verts[19] =   1.0 # w3
    verts[20] =   0.0 # r3
    verts[21] =   0.0 # g3
    verts[22] =   1.0 # b3
    verts[23] =   1.0 # a3

    ctx.draw_vertices(PIPE_PRIM_TRIANGLES,
                      nverts, 
                      nattrs, 
                      verts)

    ctx.flush()

And this is the result:

In summary, you create several state atoms, bind them to the context, and then send the geometry through the pipe driver. Full source available in Mesa3D's git repository.

To use Gallium3D's Python bindings follow these instructions.

BTW, XDS 2008 is happening now. Too bad I couldn't go this year, as I would like to meet everybody. I hope you're having a great time!
13 July 2008

Neverball on iPod

I had a lot of fun playing Neverball's minigolf alter ego, Neverputt, with my brother. Neverball itself was fun, but it was too hard to progress using the mouse. But this changed now that Neverball was ported to the iPod Touch/iPhone, using its internal accelerometer as input:

I can't help but thinking this is how the game was intended to be played.

11 July 2008

Propagating time inside recursive function cycles

I believe that a call graph showing the total function time (that is, the time spent inside the function and all its descendants) is one of the most useful visualizations of profile data, as it allows to quickly grasp what is the critical code path in your program that is taking most of the execution time.

Total function time is typically calculated by propagating the time along the call graph, from callees to callers. The problem with measuring total function time are recursive functions, as noted on gprof article:

Time propagation within strongly connected components is a problem. For example, a self-recursive routine (a trivial cycle in the call graph) is accountable for all the time it uses in all its recursive instantiations. In our scheme, this time should be shared among its call graph parents. The arcs from a routine to itself are of interest, but do not participate in time propagation. Thus the simple equation for time propagation does not work within strongly connected components. Time is not propagated from one member of a cycle to another, since, by definition, this involves propagating time from a routine to itself. In addition, children of one member of a cycle must be considered children of all members of the cycle. Similarly, parents of one member of the cycle must inherit all members of the cycle as descendants. It is for these reasons that we collapse connected components. Our solution collects all members of a cycle together, summing the time and call counts for all members. All calls into the cycle are made to share the total time of the cycle, and all descendants of the cycle propagate time into the cycle as a whole. Calls among the members of the cycle do not propagate any time, though they are listed in the call graph profile.

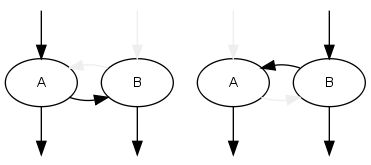
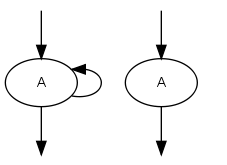
This means that, for example, the recursive call of of singly recursive functions is ignored:

<

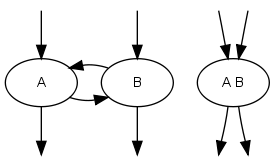
And recursion cycles with two or more functions are collapsed in a single node:

In summary, the call graph is converted in a Directed Acyclic Graph (DAG).

However this approach has several drawbacks. By treating alls functions in a recursion cycle as a single entity, you loose the ability to differentiate among them; you cannot prune individually the functions which have little contribution to the overall time, so the call graph gets bigger and more complex. Furthermore, nothing prevents a call graph to be full of recursion cycles. Actually, if you throw in the mix a statistical profiler like oprofile which produces spurious calls when the instruction pointer is sampled before/after the stack frame is setup/destroyed, and a environment like the linux kernel where there are IRQs artificially introducing function calls to the IRQ handler, you'll probably also end up with a 400KB dot file of spaghetti inside, which graphviz's dot chews for all eternity.

I tried to find a better solution for several months. Most attempts ended up with my head in an infinite loop. The solution eventually came to me once I realized that time is a linear quantity, that is, if you propagate the time along the graph assuming zero time for all but one function, repeat for every function, and take the overall sum, then you will reach the same results as doing the computation in a single pass. Given this, and the fact that by using the gprof approach we already know the time being propagated into and out of the cycle, we can then try to estimate the time propagation inside the cycle by decompose the cycle into a DAG having as root each function that is called externally. For example, taking the two function recursion example above, you can decompose the call graph in two cases:

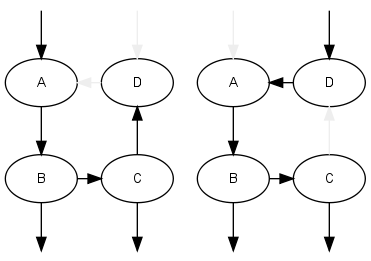
Then it is just a matter of propagating the partial time for each case, and take the total sum. The same thing can be done with any number of nodes:

The end result is an heuristic that enables gprof2dot to visually differentiate and prune recursive functions as any other function, producing consistent and meaningful results.

10 July 2008

Tracing D3D applications

I needed a tool to trace Direct3D 8 applications, like Microsoft's defunct D3DSpy or PIX. Unfortunately D3DSpy/PIX is for Direct3D 9 and above only, and no source is available, so I decided to roll my own tool.

I started with Michael Koch's sample code to intercept calls to DirectX with a proxy DLL, but when I was done I ended up writing a framework in Python to generate automatically all the code to intercept all the Direct3D 8 API (or almost any DLL for that matter), and dump the parameters in between.

The code generation mechanism is inspired in Python's ctypes module. One describes the APIs in Python like:

D3DPRESENT_PARAMETERS = Struct("D3DPRESENT_PARAMETERS", [
    (UINT, "BackBufferWidth"),
    (UINT, "BackBufferHeight"),
    (D3DFORMAT, "BackBufferFormat"),
    (UINT, "BackBufferCount"),
    (D3DMULTISAMPLE_TYPE, "MultiSampleType"),
    (DWORD, "MultiSampleQuality"),
    (D3DSWAPEFFECT, "SwapEffect"),
    (HWND, "hDeviceWindow"),
    (BOOL, "Windowed"),
    (BOOL, "EnableAutoDepthStencil"),
    (D3DFORMAT, "AutoDepthStencilFormat"),
    (DWORD, "Flags"),
    (UINT, "FullScreen_RefreshRateInHz"),
    (UINT, "PresentationInterval"),
])

IDirect3D9.methods.append(
    Method(HRESULT, "CreateDevice", [
        (UINT, "Adapter"), 
        (D3DDEVTYPE, "DeviceType"), 
        (HWND, "hFocusWindow"), 
        (DWORD, "BehaviorFlags"), 
        (OutPointer(D3DPRESENT_PARAMETERS), "pPresentationParameters"), 
        (OutPointer(PDIRECT3DDEVICE9), "ppReturnedDeviceInterface")
    ]),
)

Which will generate the following C++ code:

void DumpD3DPRESENT_PARAMETERS(const D3DPRESENT_PARAMETERS &value) {
    Log::BeginElement("UINT", "BackBufferWidth");
    DumpUINT((value).BackBufferWidth);
    Log::EndElement();
    Log::BeginElement("UINT", "BackBufferHeight");
    DumpUINT((value).BackBufferHeight);
    Log::EndElement();
    Log::BeginElement("D3DFORMAT", "BackBufferFormat");
    DumpD3DFORMAT((value).BackBufferFormat);
    Log::EndElement();
    Log::BeginElement("UINT", "BackBufferCount");
    DumpUINT((value).BackBufferCount);
    Log::EndElement();
    Log::BeginElement("D3DMULTISAMPLE_TYPE", "MultiSampleType");
    DumpD3DMULTISAMPLE_TYPE((value).MultiSampleType);
    Log::EndElement();
    Log::BeginElement("DWORD", "MultiSampleQuality");
    DumpDWORD((value).MultiSampleQuality);
    Log::EndElement();
    Log::BeginElement("D3DSWAPEFFECT", "SwapEffect");
    DumpD3DSWAPEFFECT((value).SwapEffect);
    Log::EndElement();
    Log::BeginElement("HWND", "hDeviceWindow");
    DumpHWND((value).hDeviceWindow);
    Log::EndElement();
    Log::BeginElement("BOOL", "Windowed");
    DumpBOOL((value).Windowed);
    Log::EndElement();
    Log::BeginElement("BOOL", "EnableAutoDepthStencil");
    DumpBOOL((value).EnableAutoDepthStencil);
    Log::EndElement();
    Log::BeginElement("D3DFORMAT", "AutoDepthStencilFormat");
    DumpD3DFORMAT((value).AutoDepthStencilFormat);
    Log::EndElement();
    Log::BeginElement("DWORD", "Flags");
    DumpDWORD((value).Flags);
    Log::EndElement();
    Log::BeginElement("UINT", "FullScreen_RefreshRateInHz");
    DumpUINT((value).FullScreen_RefreshRateInHz);
    Log::EndElement();
    Log::BeginElement("UINT", "PresentationInterval");
    DumpUINT((value).PresentationInterval);
    Log::EndElement();
}

HRESULT __stdcall WrapIDirect3D9::CreateDevice(UINT Adapter, 
  D3DDEVTYPE DeviceType, HWND hFocusWindow, DWORD BehaviorFlags, 
  D3DPRESENT_PARAMETERS * pPresentationParameters, 
  IDirect3DDevice9 * * ppReturnedDeviceInterface
) {
    HRESULT result;
    Log::BeginCall("IDirect3D9::CreateDevice");
    Log::BeginArg("IDirect3D9 *", "this");
    Log::BeginReference("IDirect3D9", m_pInstance);
    Log::EndReference();
    Log::EndArg();
    Log::BeginArg("UINT", "Adapter");
    DumpUINT(Adapter);
    Log::EndArg();
    Log::BeginArg("D3DDEVTYPE", "DeviceType");
    DumpD3DDEVTYPE(DeviceType);
    Log::EndArg();
    Log::BeginArg("HWND", "hFocusWindow");
    DumpHWND(hFocusWindow);
    Log::EndArg();
    Log::BeginArg("DWORD", "BehaviorFlags");
    DumpDWORD(BehaviorFlags);
    Log::EndArg();
    result = m_pInstance->CreateDevice(Adapter, DeviceType, hFocusWindow, 
      BehaviorFlags, pPresentationParameters, ppReturnedDeviceInterface);
    Log::BeginArg("D3DPRESENT_PARAMETERS *", "pPresentationParameters");
    if(pPresentationParameters) {
        Log::BeginReference("D3DPRESENT_PARAMETERS", pPresentationParameters);
        DumpD3DPRESENT_PARAMETERS(*pPresentationParameters);
        Log::EndReference();
    }
    else
        Log::Text("NULL");
    Log::EndArg();
    Log::BeginArg("IDirect3DDevice9 * *", "ppReturnedDeviceInterface");
    if(ppReturnedDeviceInterface) {
        Log::BeginReference("IDirect3DDevice9 *", ppReturnedDeviceInterface);
        if(*ppReturnedDeviceInterface) {
            Log::BeginReference("IDirect3DDevice9", *ppReturnedDeviceInterface);
        Log::EndReference();
    }
    else
        Log::Text("NULL");
        Log::EndReference();
    }
    else
        Log::Text("NULL");
    Log::EndArg();
    if(*ppReturnedDeviceInterface)
        *ppReturnedDeviceInterface = new WrapIDirect3DDevice9(*ppReturnedDeviceInterface);
    Log::BeginReturn("HRESULT");
    DumpHRESULT(result);
    Log::EndReturn();
    Log::EndCall();
    return result;
}

Which, when executed, hopefully generates something like the following XML:

<call name="IDirect3D9::CreateDevice">
  <arg type="IDirect3D9 *" name="this">
    <ref type="IDirect3D9" addr="001481E0"></ref>
  </arg>
  <arg type="UINT" name="Adapter">0</arg>
  <arg type="D3DDEVTYPE" name="DeviceType">D3DDEVTYPE_HAL</arg>
  <arg type="HWND" name="hFocusWindow">00110138</arg>
  <arg type="DWORD" name="BehaviorFlags">0x00000020</arg>
  <arg type="D3DPRESENT_PARAMETERS *" name="pPresentationParameters">
    <ref type="D3DPRESENT_PARAMETERS" addr="0012FE84">
      <elem type="UINT" name="BackBufferWidth">250</elem>
      <elem type="UINT" name="BackBufferHeight">250</elem>
      <elem type="D3DFORMAT" name="BackBufferFormat">D3DFMT_X8R8G8B8</elem>
      <elem type="UINT" name="BackBufferCount">1</elem>
      <elem type="D3DMULTISAMPLE_TYPE" name="MultiSampleType">D3DMULTISAMPLE_NONE</elem>
      <elem type="DWORD" name="MultiSampleQuality">0x00000000</elem>
      <elem type="D3DSWAPEFFECT" name="SwapEffect">D3DSWAPEFFECT_DISCARD</elem>
      <elem type="HWND" name="hDeviceWindow">00110138</elem>
      <elem type="BOOL" name="Windowed">1</elem>
      <elem type="BOOL" name="EnableAutoDepthStencil">0</elem>
      <elem type="D3DFORMAT" name="AutoDepthStencilFormat">D3DFMT_UNKNOWN</elem>
      <elem type="DWORD" name="Flags">0x00000000</elem>
      <elem type="UINT" name="FullScreen_RefreshRateInHz">0</elem>
      <elem type="UINT" name="PresentationInterval">2147483648</elem>
    </ref>
  </arg>
  <arg type="IDirect3DDevice9 * *" name="ppReturnedDeviceInterface">
    <ref type="IDirect3DDevice9 *" addr="0043289C">
      <ref type="IDirect3DDevice9" addr="0014EBA0"></ref>
    </ref>
  </arg>
  <ret type="HRESULT">D3D_OK</ret>
</call>

Which when viewed by a XML and CSS capable browser like Firefox or Internet Explorer will show:

Hovering on value will popup its type; and with Firefox, hovering on a pointer will show the referred data structure.

Source and binaries available.

25 June 2008

Saving desk space

Space is tight around here in Tokyo. The high population density is reflected on the public transportation system, land price, cultural traditions, house sizes, and ultimately on my desk size. However my daily work implies to interact with multiple hardware. This is what I do to save desk space.

Buy small boxes.
Obviously, the smaller the boxes are the more you can fit under your desk. However beware that too small and exchanging the parts becomes as delicate and time-consuming as clock making.
Use a KVM switch.
Using 4-way USB+VGA KVM not only eliminates the need of having a keyboard, mouse, and monitor for each box, but also saves on cabling. Decent KVM switchs allow you to switch machine directly from the keyboard, so it saves you time too.
Use synergy
The KVM switch is nice, but for debugging/testing it is actually more useful to have a separate monitor for the test machine. synergy fits nicely here, as it allows to share the mouse and keyboard between multiple computers across the network, each with its own display. You switch between machines by moving the mouse off the edge of your screen. It also shares the clipboard and works seemingly across Windows and other OSes.
Use remote access
Often you don't even need a physically connected display, and remote access via protocals such as SSH, Remote X, Remote Desktop Protocol, and VNC are sufficient for development.
Use virtualization/emulation
You can't beat the space taken by a virtual machine like VMWare or VirtualBox. Unfortunately, rarely can this be used in practice. My current use of it consists in running Windows development tools inside Linux.

I hope you find these tips useful. Please share any other desk space saving tips you have.

28 April 2008

Oops

Sorry about planet.fd.o pollution...

I'll stop playing with the Blogger tags now...

m(_ _)m

27 April 2008

Gallium3D: Introduction

At Tungsten Graphics I've been working in Gallium3D — a very promising architecture to develop 3D graphic drivers for multiple operating systems and graphic APIs.

It comes as no surprise that Gallium3D is a large and complex piece of software. So I've decided to write a bit about it in the hope of helping newcomers to get more quickly familiarized with it.

A few adverts: I had little to do with Gallium3D's design — that's the work of much brighter people such as Keith Whitwell and Brian Paul — so a lot of the rationale written here is partly my own speculation; also Gallium3D architecture is still under flux (much less than before, but still), so this refers to its current state.

Architecture

Gallium3D architecture can be described as a set of interfaces and a collection of supporting libraries.

Gallium3D is not a framework. All attempts of using the Hollywood Principle of "Don’t call us, we’ll call you." for 3D driver development imply making assumptions about the hardware behavior which quickly are proven wrong as new hardware generations come along. Instead, by simply providing a set of libraries, Gallium3D's can more easily adapt in this rapidly evolving field. So Gallium3D's principle is indeed "Is up to you to call us, as we won't call you". Is is necessary to have this principle in mind to understand how all Gallium pieces fit together.

Modules

State tracker
Translates the graphics API state (e.g., blend mode, texture sampling mode, etc.), shaders, and graphics primitives into something that the pipe driver below understands.
Pipe driver
Translates the state, shaders, and primitives in something that the hardware understands (e.g., register writes, shader/command buffers, and vertex buffers).
Winsys
Instantiates and binds all pieces above (state tracker and pipe driver) together with the OS, window system, and 2D display driver.
Auxiliary modules
Provide optional auxiliary services such as, software interpretation of shaders for hardware without hardware vertex shader support, state caching, buffer management, etc.
Module dependency table
Graphics APIGraphics HardwareOS
Auxiliary modulesNoNoNo
State TrackerYesNoYes/No(1)
Pipe driverNoYesNo
WinsysYesYesYes

(1) The state tracker depends on the graphics API, so it can be made OS-independent for OS-independent APIs (such as OpenGL), but not for OS-dependent APIs (such as Direct3D)

The higher the module is in the previous table the more it is reused (auxiliary modules,State Tracker). The lower it is, more times it will have to be rewritten (Winsys). Although the dividing line between these modules is blurry, we are always interested in moving functionality upwards as much as possible. This is one of the areas where Gallium3D architecture is under flux: when we support a new graphics hardware, graphics API, or OS and realize that there is some functionality that can be generalized then we move it upwards; if we realize that previously made assumptions no longer hold, then we move that functionality downwards.

Interfaces

State tracker <-> Pipe driver
There is a per-context interface(p_context.h) and a global/per-screen interface(p_screen.h).
State tracker <-> Winsys
p_winsys.h
Pipe driver <-> Winsys
Besides p_winsys.h above, each pipe driver has its own additional winsys interface: sp_winsys.h (pure-software pipe driver), i915_winsys.h (Intel 915/945 pipe driver), etc.

Data flow

The data flow is actually quite simple to understand:

The graphics state and primitives created in the application are successively broken down in things more close to the hardware as they progress in the pipe line. One of Gallium3D's biggest achievement is defining a set of interfaces that allows the central piece -- the pipe driver --, to be reused in different graphics APIs and OSes.

If you zoom up the microscope one level, you can detect two extra (auxiliary) modules:

CSO context
Optionally used by the state tracker for Constant State Object (CSO) caching. The state passed to the pipe driver is immutable (constant) to simplify the pipe driver implementation. To avoid the performance penalty of always destroying/creating these state objects, these are stored in a cache.
Draw module
Optionally used by the pipe driver to do vertex transform, lighting, and primitive clipping in software, for hardware without support for it.

The rest...

That's all for today. Hopefully soon I'll write a bit more about these modules in more detail. I actually started my way in Gallium3D from Winsys and only recently started working on the State tracker, so there is some studying left to do.

Until then, to learn more about Gallium3D see: